
JUICE THE BLUEBERRY
The New Geography of American Industry
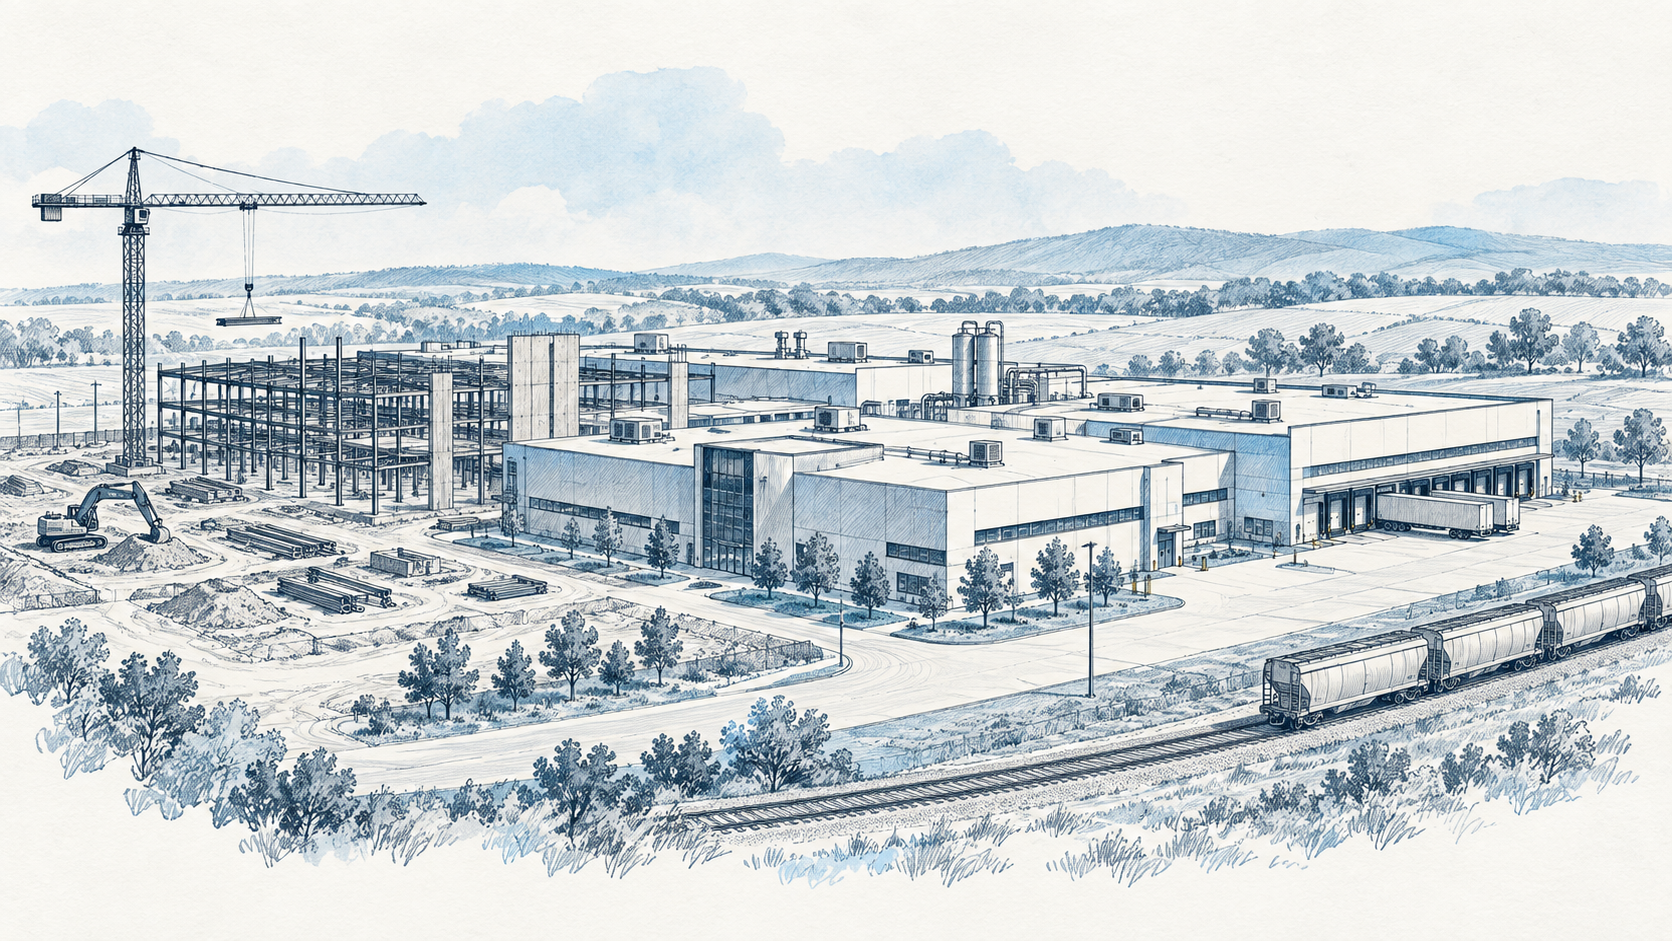
The map of factory construction is changing. A construction site is not yet an operating factory.
A new factory announcement is easy to count. A functioning plant is harder. Between the press release and the first shipment lie permits, buildings, equipment, utilities, hiring, training, and customers. An honest map of American industry must show each of those stages separately.
The Census Bureau publishes monthly construction spending, including private manufacturing construction and subnational series. These measures tell us where money is being put into structures. They do not tell us whether a particular plant has begun production or how many permanent jobs it created. The Bureau of Labor Statistics publishes manufacturing employment by state and area, but those figures include established plants as well as new ones. Comparing the two series can suggest a shift; it cannot by itself credit one announced project with a regional employment gain.
Consider three possible maps: announced investment, construction actually put in place, and manufacturing jobs. They may look quite different. A region can gain construction spending while its factories automate, consolidate, or hire slowly. Another can add jobs using existing buildings. Output is a fourth measure and should be checked against Census manufacturing and BEA industry data before declaring a renaissance.
The working conclusion is modest: investment announcements reveal intentions, construction data reveal a stage of execution, and employment and output reveal different kinds of realized activity. For the next reporting pass, choose a fixed cohort of named projects, record their announced and actual opening dates, and verify jobs and output at the plant level. Until then, claims that any particular state has “won” the new industrial geography are premature.
Sources: Census construction data; BLS state manufacturing employment.